Showing posts with label recession and recovery. Show all posts

Thursday, September 6, 2018

L-Shaped Recovery and the Trampoline Effect


Some years ago, I talked about government interference affecting the economy. There’s a pair of posts: Parabolas and The Trampoline Effect. When there are downturns in the economy, there’s usually a natural rebound, forming a parabola, like a U. The bounce back usually reaches and exceeds the start of the fall pretty quickly. But if government steps in to “help,” or interfere, then you get something more like “help” on a trampoline, when someone steps in purportedly make the bounce higher. That help disturbs the natural up and down, and takes the energy out of the bottom of the bounce, so you don’t go back up. You just sort of stumble, and the trampoline flattens. And then you have to get going again from scratch.

In economist terms, this is an L-shaped recession recovery, instead of the usual U-shaped recovery.
Here’s the definition

L shaped recession—refers to a period of stagnant recovery after initial fall in GDP. Even though technically the economy may have positive growth (e.g. 0.5%) it still feels like a recession because growth is very slow and unemployment high.
You know the phrase, about the scariest words: “I’m from the government, and I’m here to help.” Government’s role isn’t to interfere, or intervene. It’s to set up the background for free enterprise to take place. 

Government isn't the only interference that can cause an L-shaped recession, but it's the usual suspect. When we look at the past decade, we see an L-shaped recession/recovery, and it wasn't just bad luck; it was government caused. 

There are a number of measures of how well the economy is doing. Growth in GDP is one. In fact, a recession has a specific definition related to GDP: "a period of temporary economic decline during which trade and industrial activity are reduced, generally identified by a fall in GDP in two successive quarters."


The converse is that two successive quarters of growth, however minimal, signify the end of the recession. But in an L-shaped recession, getting to technical recovery likely takes longer, probably over a year, rather than merely months. But getting back to starting position can take much longer, multiple years.

The L-shaped recession recovery looks like this:


Such a "recovery" can take so long that various opinions may start calling it a square root-shaped recovery, meaning that, instead of ever getting back up, we should expect a new, permanent, lower growth reality. Obama and George Soros agreed on this "just the new reality" description of the 2008-2009 Great Recession. The malaise economy of Jimmy Carter was also described as a new normal that turned out not to be normal, after a bit of a Reagan tax cut.

And the Great Recession wasn’t a square root-shaped “recovery,” we now know, because the malaise of extremely low growth wasn’t permanent. It went away as soon as we had a government regime change that made necessary changes. They haven’t been extraordinary changes: lower taxes across the board, and concerted attempts to get rid of burdensome regulations.

We didn’t have to get all the way to the ideal lowest possible tax rate, just better. And we didn’t have to get rid of all burdensome regulation, just go in that direction, and stop the threat of ever more regulations that could be placed at any time, causing businesses to be wary about investing and growing. When people are free to make use of their own money, and can plan without government-induced uncertainty, that's the energy we need to get the economy moving back upward.

We can see some examples of the L-shape in various charts. A typical chart for showing recessions is GDP growth. This one, from the Center on Budget and Policy Priorities (CBPP)[i]


Because growth, by definition, rises, in order to see the parabolas and other shapes of recessions and recoveries, you need to turn the chart somewhat sideways, so the rise line is horizontal. The green is to show the L-shape.


Besides GDP growth, there are some other measures. One is unemployment. Here’s a comparison of recent recessions and up to five years out.  In this chart the U-shape, or parabola, is upside down, because we want unemployment to be low. It goes up during the recession and down afterward. You can see that the unemployment spike was a bit higher in 1982, but by one year out had reached its starting point, and then continued dropping. The 2009 recession went higher half a year out, had some downs and ups for a year and a half, and afterward only slowly began dropping back down, taking seven years or more to reach pre-recession rates.


It’s possible for unemployment to go down even though there are more people not employed. Unemployment is measured by taking some combination of people applying for unemployment benefits and polling. That misses people who would be looking for work in a less hopeless economy. People who can’t find work could try to get more education, or could be just staying home. They don’t get counted. So another way to look at economic vitality is the employment-to-population ratio.

This one gives us a really clear picture of the L-shaped recession/recovery. I’ve highlighted the Great Recession in green, and in yellow are a few other more typical recessions with a quick rebound. On this chart, it looks like there might be another L-shaped recession just after 1960.


Another chart that shows the L-shape is average private sector hourly earnings. The housing and banking bubbles burst in the last quarter of 2008, which precipitated the drop. They didn’t start to rise again until 2015, and we’re still quite a distance from the starting point. The source for this chart seemed certain, later in the article, that things would have been much worse without the government interference. It’s hard to show an alternative version to use for comparison, but it is my assertion that government interference caused the intensity of the problem as well as the continuation.


The 1929 market crash was similar. It was beginning to right itself within months, but then government stepped in with one intervention after another, intensifying and continuing the pain for more than a decade. It wasn’t the war that ended the depression, because there was so much to produce for the war; it was that FDR focused on the war instead of the economy, and he largely quit experimenting with ever more interventions.

There was some good news from The Heritage Foundation's 2018 Index of Economic Freedom. We used to be ranked “mostly free,” but had been less free since the beginning of the Obama administration—or maybe since the legislative takeover by Democrats two years before that. Now we’re moving back toward freedom.

The United States, ranked “mostly free,” had not been performing well in the index over the last decade. That precipitous slide has now fortunately come to a halt, with signs of renewed economic growth reinforced by major regulatory and tax reforms that elevate business confidence and investment. It is notable that the U.S. economy grew at a rate of about 3 percent in the last three quarters, something that economists said was very unlikely just a year ago. For the first time in a while, the United States isn’t just economically stronger. It has a real chance to become economically freer in the coming years.

We’ve had two additional quarters of higher growth since that assessment last February. So the news is even better.

When somebody interferes with your jump back up on a trampoline, it takes some regathering your balance and re-energizing your jump. And that gets harder when the “friend” keeps their hand on the trampoline. But once they get out of the way, the energy you put into the jump gets you rising again.
It’s good that happens in the economy too. When we move closer to a free market, not only do we become more prosperous, we become more free.

_______________________________
[i] CBPP is the source for the remaining graphs in this piece, although some have my marks on them.

Tuesday, August 16, 2016

As I've Said Before

Sometimes it’s worth saying things again. The economy changes, but economic principles don’t. So some of what I’ve written can be said again and apply as well today.

I’ve posted a couple of collections of economic “best of” posts:

·         In June of 2013, Best of the Spherical Model, Part II 
·         In March of 2015, More of the Best, Part III 
Among these are some that I think are repeating in full. These two go together: “Parabolas,” from November 2011, and “The Trampoline Effect,” from March 2012.  When we’re in the longest malaise (being called a tepid recovery) since the Great Depression, maybe it’s worth reviewing these.

Parabolas

Natural paraabolic shape
of a recession and recovery
With recessions, the rule is: what goes down must come back up. The natural shape of a recession is a parabola. There’s a sharp drop to as low as it’s going to go, and then the direction changes upward during recovery. If it is allowed to follow the natural course of events, the recovery will essentially mirror the drop—and then keep going up. 
This is a concept my sons, Economic Sphere and Political Sphere, have been sharing with me from time to time. I don’t have the economic math skills to reproduce all the math logic for you, unfortunately. But I think the basic concept will do. Recessions happen because the market needs to correct, from a bubble or maybe a natural disaster--something that interferes with the natural long-term aggregate growth of the free market. But once there’s a drop, then a naturally growing market returns.  

Political Sphere shared an article from Forbes about the concept that recessions follow a natural course—unless interfered with. The article makes that point that the excuse “this time is different” is never true. 
L-shaped recession, natural
recovery is prevented


Real trouble happens when there is interference, usually intended to “help.” According to Wikipedia, one of the shapes a recession can take is the L shape. In this one, the sharp drop happens just as you would expect. But then, instead of bouncing on the bottom and coming back up, the level just sort of dribbles along horizontally near the bottom. Other names for this are “depression,” “lost decade,” and “malaise.” These are all terms beginning to be applied to our current L-shaped recession. They are terms that applied to FDR’s Great Depression as well. 

What is it that causes this recession to be different, to languish at the bottom instead of bouncing back? Government interference. How do we know? 

This is maybe more than you wanted, but here’s a basic formula: 

Y = C + I + G + NX 

Y is GDP (production) in actual dollars.
C is consumption, which is a function of Y-T (taxes).
I is investment, or infusion of new capital (not spending on used materials, or stock exchanges).
G is government spending.
NX is net exports. 

Government can affect Y by increasing spending or raising or lowering taxes. More taxes means less money for consumers to spend, and less taxes means more money for consumers to spend. Indirectly investment will be affected if Y decreases, when there is less profit to be made. But mainly the other way government can change Y is by increasing government spending.  

I had to ask Economic Sphere why the formula includes “+G” instead of “-G.” In theory, G is just another product consumers (we the people) spend money on. To some degree it’s necessary. So the amount spent on G is just another part of the measure of GDP. However, when spending on government is too high—includes debt—it temporarily appears that the G portion of the economy shows actual growth in GDP. But that is an illusion.

natural ups and downs of
business cycle show a sine wave
It appears, in the short run, that government spending (or stimulus) increases Y. But Y’s rate of growth is, in a natural free market, fairly constant. There is fluctuation, an ongoing sine wave, or little rises and dips, but you can draw a line through that at approximately the natural rate of growth (maybe somewhere near 4%). Government spending can’t change that. It doesn’t affect aggregate supply; it only affects aggregate demand. So it may appear for a time that it has affected growth, but there will be a natural pull back to the equilibrium point where aggregate supply and demand intersect. There will be a correction. So the more government does to try to make the market go up, the greater will be the eventual correction back to the natural rate of growth. 

The longer and greater the government over-expenditures, the more drastic will be the inevitable correction. 

So what happens if government sees that inevitable drop and tries to prevent it—with more government spending? It causes an even greater drop. If the measures are taken after the drop, presumably in an effort to stop more drop or cause a rise, it interferes with the natural recovery. That is what we’re seeing now. 

Greater government spending at a time when great government spending already caused the dip is like hitting the economy over the head and beating it down. Every new interference, every new beat down, leaves the economy languishing down at the bottom, unable to rise because of the repeated drop-causing interferences. When they say, “The economy was in much worse shape than we thought; imagine how bad a shape we’d be in if we had done nothing,” you can know for certain that things are worse because of what they did in their ignorant attempts to control a natural force.  

If government wants to have a positive effect on GNP, it needs to cut spending. Since it can’t (won’t) cut to zero, the next best thing would be to cut to the bare bones of the enumerated powers of the Constitution. At the same time, lowering rather than raising taxes will help. Both lowered government spending and lowered taxes leave more money available for growth.

The Trampoline Effect
The other night I was reading something about the recovering economy—a recovery so tepid we can’t perceive it; instead we must take government’s word for it. Never comforting. And the reading led me to talk with my son Political Sphere about the concept that, the deeper the recession, the stronger the following recovery. I wrote about this principle with more detail in “Parabolas” on November 21st.
So, we were discussing this concept, and Political Sphere unveiled what he calls the Trampoline Effect. On a trampoline, the harder you come down (from a higher or heavier fall), the higher and more powerful the bounce back up. But if a big brother (yes, he worded it that way, with plenty of extra meanings) steps in to “help,” it doesn’t help. It usually disturbs the bounce, taking the energy out of it, and you end up with buckled knees and a few small bounces fading into flatness.
photo from trampoline.com

Picture the difference between a parabola (the natural down and back up bounce) and what is euphemistically referred to as an L-shaped recovery, but is really just the dribble that happens from interference in the bounce.
Big Brother “helping” is the government stepping in, taking actions that interfere with the energy of the natural growing economy.

So, every time you hear someone say, “We had to do something,” or “Think how bad it would be if we hadn’t taken action,” translate that in your mind to the Trampoline Effect. Does the jumper need you to step in and “help” in order to bounce back up? No, that is going to happen unless you interfere.

A recovery, by definition, is coming back up to at least the starting point. If that hasn’t happened, we’re either still going down, or we’re stuck down flat because of the interference. What we need is for Big Brother to get out of the way so we can make a few small tentative bounces and put our energy into building up a good parabolic rise. But every time he steps in, he zaps the energy out of your bounce and leaves you flagging.

Friday, July 13, 2012

Low Taxes Don't Cause Recessions: Part II


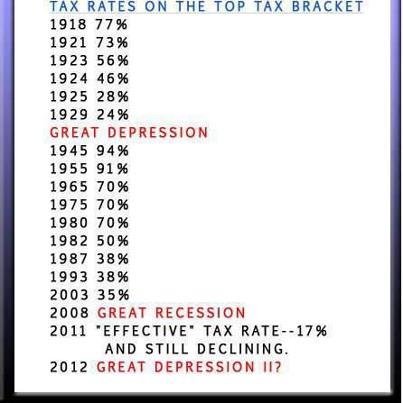
We were previously talking about the comparison between this politically manipulated chart (above) and this more complete one (below), along with some relevant history.

http://www.taxpolicycenter.org/taxfacts/displayafact.cfm?Docid=213

We had gotten to pretty much the middle of the Great Depression—the big blank part on the propaganda chart. What we know about that time was that taxes were high and wages were kept artificially high—both contributing to extended high unemployment and a sluggish economy stuck in a trough, instead of bouncing back. Added to this were seemingly arbitrary regulations interfering with various sectors of the economy. Unpredictability is another factor that prevents investment and job growth.
These things look familiar because we’re seeing them, close up, right now. And the administration just scratches its collective head and says, “We just need to keep doing more of the same until it works.” Please insert definition of insanity here.
Back to the timeline. Some people assume that the Great Depression ended with the outbreak of WWII in 1941. What happened then was that FDR stopped some of the micromanaging of the economy to focus on the safety of the nation in a dangerous world. (We can thank him for that; at least he valued the nation enough.) Resources had to go to military. Many workers, including the unemployed, went into the military, leaving openings in manufacturing and elsewhere that needed filling. So by some definitions, the Depression did end.
Are you familiar with the broken glass example? A vandal comes and breaks a baker’s window. The baker then employs a glazier to replace the window, so the glazier has more income, which he spends to by a suit. And so on, implying that the economy is better off because of the broken window. But this looks only at what is seen, not what is unseen. The baker was building up capital to buy a larger oven and hire more workers. But he had to use the capital on the window, which he wouldn’t have had to do without the breakage. So there was a loss in the economy to the baker, to his possible employees that didn’t get hired, and to the manufacturer of the new oven that didn’t get purchased. Those losses are unseen. The economy is actually worse off because of the unnecessary glass breakage. Thomas Sowell describes seen vs. unseen in his piece this week called “Jobs Versus Net Jobs.”  
The point here is that, while there was visible economic activity caused by WWII, the capital spending didn’t really grow the economy. Spending for the war was necessary, just as repairing the window would be once it was broken. But what helped the economy was getting FDR to stop getting in the way of it.
Progressives being what they are, they were merely more dormant during the war. What you have following the war is still extremely high marginal tax rates and more government interference. This is the period where people used the phrase, “To err is Truman.”
Right after the war the top marginal rates were dropped slightly, from an insane 94% to 86.45%, and then to 82.13%. Let’s be honest; a drop to 82.13%, while better than 94%, is still so confiscatory that no one capable of making the top level of income would pay it. Such a person would find the numerous loopholes placed there specifically for the purpose of avoiding payment. (Lobbying for specific favors was pretty much as described in the fictional version, Atlas Shrugged.) Or that person would set aside money in places that would not be considered income (trusts, investments, or just a jar buried in the yard), rather than keep earning income without getting to enjoy it.
The rate bounded up again to 91% and stayed there for a decade. There’s something to be said for stability. But, again, no one paid this rate. It brought in essentially no revenue. The data missing from the chart is what the rates were for the next couple of tiers lower, and how those near top earners responded to them; also missing is information about other government interference affecting stability in the market. As a rule, the more profit an earner can count on using, the more the earner is likely to risk it as capital investment—leading to economic growth.
You can see a steady and slightly lower 70% marginal tax rate from 1965 through the last Carter budget of 1981. (Back in the 73-74 recession, in those Republican years before Carter, unemployment was a painful 4-6%; yes, that was considered high back then, before Carter suggested we get used to a different version of normal.) Steadiness is a good thing. But, again, high rates mean high avoidance. And other government interference, such as price controls and regulation in chosen sectors, equals economic drag.
Then, under Reagan, despite a Democrat Senate and House, we see a drop in marginal tax to 50% then 38%, and further under Bush 41 to 28%. Recovery and economic growth ensued, disrupted only when Bush reneged on the “no new taxes” pledge. Revenues also went up, even with the much lower rates, offering evidence that Laffer is right. (Read about the Laffer Curve here and my piece on it here.) Rates went up under Clinton, but then they steadied with the coming of the election of a Republican House in 1994 (first time in 40+ years).
We had some recessions, and burst bubbles, during the last three post-Carter decades. But there is no evidence of any recession taking place because top marginal tax rates were too low. In fact, it is harder for Federal Reserve interference and federal government over-regulation to do their damage when the rates are kept low enough. That’s why it took until after 2006, when Democrats took control of Congress, before the build-up of meddling in the housing sector finally resulted in that bubble bursting.
Higher education costs are extremely high right now, without an equivalent payoff to consumers (students). Government interference has led to both the higher costs and the lower quality and value. Health care costs rise the more government interferes as well—which is why we must repeal the monstrosity so untruthfully titled the Patient Protection and Affordable Care Act. Both of these are likely to become bubble bursts rippling into recession conditions. No level of top tax rates, either high or low, would prevent the eventual bursts of any bubbles.
It comes down to this: if someone thinks low taxes cause recessions and high taxes are good for the economy, would you want such a person to get near any sector of the economy that you care about? Smart people just say no.

Monday, November 21, 2011

Parabolas

natural parabolic shape
of a recession and recovery
With recessions, the rule is: what goes down must come back up. The natural shape of a recession is a parabola. There’s a sharp drop to as low as it’s going to go, and then the direction changes upward during recovery. If it is allowed to follow the natural course of events, the recovery will essentially mirror the drop—and then keep going up. 

This is a concept my sons, Economic Sphere and Political Sphere, have been sharing with me from time to time. I don’t have the economic math skills to reproduce all the math logic for you, unfortunately. But I think the basic concept will do. Recessions happen because the market needs to correct, from a bubble or maybe a natural disaster--something that interferes with the natural long-term aggregate growth of the free market. But once there’s a drop, then a naturally growing market returns.  

Political Sphere shared an article from Forbes about the concept that recessions follow a natural course—unless interfered with. The article makes that point that the excuse “this time is different” is never true. 

L-shaped recession, natural
recovery is prevented
Real trouble happens when there is interference, usually intended to “help.” According to Wikipedia, one of the shapes a recession can take is the L shape. In this one, the sharp drop happens just as you would expect. But then, instead of bouncing on the bottom and coming back up, the level just sort of dribbles along horizontally near the bottom. Other names for this are “depression,” “lost decade,” and “malaise.” These are all terms beginning to be applied to our current L-shaped recession. They are terms that applied to FDR’s Great Depression as well. 

What is it that causes this recession to be different, to languish at the bottom instead of bouncing back? Government interference. How do we know? 

This is maybe more than you wanted, but here’s a basic formula: 

Y = C + I + G + NX 

Y is GDP (production) in actual dollars.
C is consumption, which is a function of Y-T (taxes).
I is investment, or infusion of new capital (not spending on used materials, or stock exchanges).
G is government spending.
NX is net exports. 

Government can affect Y by increasing spending or raising or lowering taxes. More taxes means less money for consumers to spend, and less taxes means more money for consumers to spend. Indirectly investment will be affected if Y decreases, when there is less profit to be made. But mainly the other way government can change Y is by increasing government spending.  

I had to ask Economic Sphere why the formula includes “+G” instead of “-G.” In theory, G is just another product consumers (we the people) spend money on. To some degree it’s necessary. So the amount spent on G is just another part of the measure of GDP. However, when spending on government is too high—includes debt—it temporarily appears that the G portion of the economy shows actual growth in GDP. But that is an illusion. 

natural ups and downs of
business cycle show a sine wave
It appears, in the short run, that government spending (or stimulus) increases Y. But Y’s rate of growth is, in a natural free market, fairly constant. There is fluctuation, an ongoing sine wave, or little rises and dips, but you can draw a line through that at approximately the natural rate of growth (maybe somewhere near 4%). Government spending can’t change that. It doesn’t affect aggregate supply; it only affects aggregate demand. So it may appear for a time that it has affected growth, but there will be a natural pull back to the equilibrium point where aggregate supply and demand intersect. There will be a correction. So the more government does to try to make the market go up, the greater will be the eventual correction back to the natural rate of growth. 

The longer and greater the government over-expenditures, the more drastic will be the inevitable correction. 

So what happens if government sees that inevitable drop and tries to prevent it—with more government spending? It causes an even greater drop. If the measures are taken after the drop, presumably in an effort to stop more drop or cause a rise, it interferes with the natural recovery. That is what we’re seeing now. 

Greater government spending at a time when great government spending already caused the dip is like hitting the economy over the head and beating it down. Every new interference, every new beat down, leaves the economy languishing down at the bottom, unable to rise because of the repeated drop-causing interferences. When they say, “The economy was in much worse shape than we thought; imagine how bad a shape we’d be in if we had done nothing,” you can know for certain that things are worse because of what they did in their ignorant attempts to control a natural force.  

If government wants to have a positive effect on GNP, it needs to cut spending. Since it can’t (won’t) cut to zero, the next best thing would be to cut to the bare bones of the enumerated powers of the Constitution. At the same time, lowering rather than raising taxes will help. Both lowered government spending and lowered taxes leave more money available for growth.