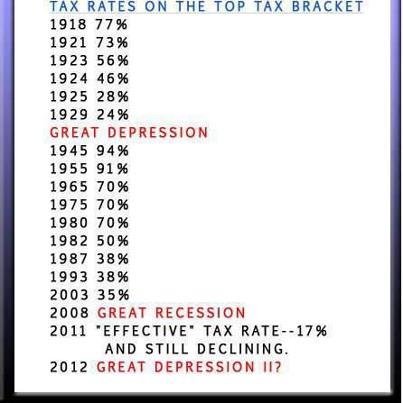
We were previously talking about the comparison between this politically manipulated chart (above) and this more complete one (below), along with some relevant history.
 |
| http://www.taxpolicycenter.org/taxfacts/displayafact.cfm?Docid=213 |
We had gotten to pretty much the middle of the Great Depression—the big blank part on the propaganda chart. What we know about that time was that taxes were high and wages were kept artificially high—both contributing to extended high unemployment and a sluggish economy stuck in a trough, instead of bouncing back. Added to this were seemingly arbitrary regulations interfering with various sectors of the economy. Unpredictability is another factor that prevents investment and job growth.
These things look familiar because we’re seeing them, close up, right now. And the administration just scratches its collective head and says, “We just need to keep doing more of the same until it works.” Please insert definition of insanity here.
Back to the timeline. Some people assume that the Great Depression ended with the outbreak of WWII in 1941. What happened then was that FDR stopped some of the micromanaging of the economy to focus on the safety of the nation in a dangerous world. (We can thank him for that; at least he valued the nation enough.) Resources had to go to military. Many workers, including the unemployed, went into the military, leaving openings in manufacturing and elsewhere that needed filling. So by some definitions, the Depression did end.
Are you familiar with the broken glass example? A vandal comes and breaks a baker’s window. The baker then employs a glazier to replace the window, so the glazier has more income, which he spends to by a suit. And so on, implying that the economy is better off because of the broken window. But this looks only at what is seen, not what is unseen. The baker was building up capital to buy a larger oven and hire more workers. But he had to use the capital on the window, which he wouldn’t have had to do without the breakage. So there was a loss in the economy to the baker, to his possible employees that didn’t get hired, and to the manufacturer of the new oven that didn’t get purchased. Those losses are unseen. The economy is actually worse off because of the unnecessary glass breakage. Thomas Sowell describes seen vs. unseen in his piece this week called “Jobs Versus Net Jobs.”
The point here is that, while there was visible economic activity caused by WWII, the capital spending didn’t really grow the economy. Spending for the war was necessary, just as repairing the window would be once it was broken. But what helped the economy was getting FDR to stop getting in the way of it.
Progressives being what they are, they were merely more dormant during the war. What you have following the war is still extremely high marginal tax rates and more government interference. This is the period where people used the phrase, “To err is Truman.”
Right after the war the top marginal rates were dropped slightly, from an insane 94% to 86.45%, and then to 82.13%. Let’s be honest; a drop to 82.13%, while better than 94%, is still so confiscatory that no one capable of making the top level of income would pay it. Such a person would find the numerous loopholes placed there specifically for the purpose of avoiding payment. (Lobbying for specific favors was pretty much as described in the fictional version, Atlas Shrugged.) Or that person would set aside money in places that would not be considered income (trusts, investments, or just a jar buried in the yard), rather than keep earning income without getting to enjoy it.
The rate bounded up again to 91% and stayed there for a decade. There’s something to be said for stability. But, again, no one paid this rate. It brought in essentially no revenue. The data missing from the chart is what the rates were for the next couple of tiers lower, and how those near top earners responded to them; also missing is information about other government interference affecting stability in the market. As a rule, the more profit an earner can count on using, the more the earner is likely to risk it as capital investment—leading to economic growth.
You can see a steady and slightly lower 70% marginal tax rate from 1965 through the last Carter budget of 1981. (Back in the 73-74 recession, in those Republican years before Carter, unemployment was a painful 4-6%; yes, that was considered high back then, before Carter suggested we get used to a different version of normal.) Steadiness is a good thing. But, again, high rates mean high avoidance. And other government interference, such as price controls and regulation in chosen sectors, equals economic drag.
Then, under Reagan, despite a Democrat Senate and House, we see a drop in marginal tax to 50% then 38%, and further under Bush 41 to 28%. Recovery and economic growth ensued, disrupted only when Bush reneged on the “no new taxes” pledge. Revenues also went up, even with the much lower rates, offering evidence that Laffer is right. (Read about the Laffer Curve here and my piece on it here.) Rates went up under Clinton, but then they steadied with the coming of the election of a Republican House in 1994 (first time in 40+ years).
We had some recessions, and burst bubbles, during the last three post-Carter decades. But there is no evidence of any recession taking place because top marginal tax rates were too low. In fact, it is harder for Federal Reserve interference and federal government over-regulation to do their damage when the rates are kept low enough. That’s why it took until after 2006, when Democrats took control of Congress, before the build-up of meddling in the housing sector finally resulted in that bubble bursting.
Higher education costs are extremely high right now, without an equivalent payoff to consumers (students). Government interference has led to both the higher costs and the lower quality and value. Health care costs rise the more government interferes as well—which is why we must repeal the monstrosity so untruthfully titled the Patient Protection and Affordable Care Act. Both of these are likely to become bubble bursts rippling into recession conditions. No level of top tax rates, either high or low, would prevent the eventual bursts of any bubbles.
It comes down to this: if someone thinks low taxes cause recessions and high taxes are good for the economy, would you want such a person to get near any sector of the economy that you care about? Smart people just say no.


